Closing the books should be a formality. For most finance teams it is a week-long scramble to make disconnected systems agree.
The benchmarks bear it out. APQC puts the median month-end close at around six calendar days; the top quartile manage under five, while the slowest take ten or more. And the single biggest consumer of that time is manual reconciliation: BlackLine research attributes roughly 30 to 40% of the close to it, with individuals spending 10 to 20 hours a month just reconciling. None of that work moves the business forward.
Call it the reconciliation tax, the recurring cost that fragmented billing quietly levies on finance. This is where the time goes, why fragmentation creates it, and what teams reclaim once the systems are joined up.
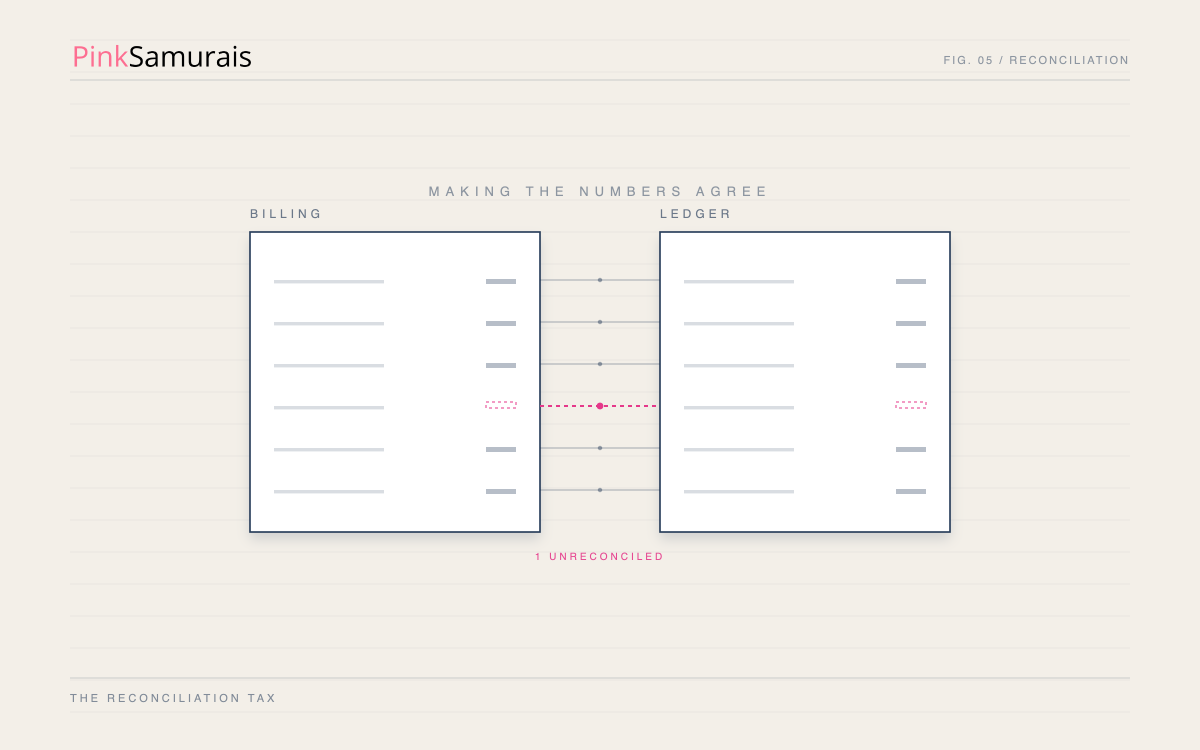
Table of Contents
| Section | |
|---|---|
| 1) | The reconciliation tax: where the week goes |
| 2) | Why fragmentation creates the work |
| 3) | The knock-on cost: a slow close and trapped cash |
| 4) | What teams reclaim once the systems are joined |
| 5) | How to size your own reconciliation cost |
| 6) | Frequently Asked Questions |
1) The reconciliation tax: where the week goes
Reconciliation is the work of making the numbers in different systems agree before anyone can trust the books. It is necessary, but it is also pure overhead: it adds no revenue, no insight, and no strategy. In a fragmented environment it expands to fill days.
The numbers are consistent across independent benchmarks:
- The close still takes about a week. APQC benchmarking puts the median monthly close at roughly six calendar days, with top performers under five and the slowest at ten or more.
- Reconciliation is the biggest slice. BlackLine research attributes 30 to 40% of close-cycle time to manual reconciliation, with individuals spending 10 to 20 hours a month on it.
- It bleeds into every week, not just close. An Adyen study found around a third of companies lose at least a full working day every week to financial reconciliation.
Put those together and a meaningful share of your finance team's capacity is spent matching data instead of analysing it, every single month.
2) Why fragmentation creates the work
The reconciliation tax is a symptom; fragmentation is the cause. Contract terms live in one system, billing logic in another, usage data in a third, and the financial records in the ERP. No single platform holds the complete picture. MGI Research frames the underlying problem precisely: revenue leakage is the variance between contractually obligated revenue and actual recognised revenue, and that variance only exists because the systems that should agree do not.
So before the books can close, someone has to manually stitch it together: does the billing match the contract, does the usage match the invoice, does the invoice match the ledger? A typical reconciliation cycle runs three to five business days and pulls in several people, and it repeats every period.
In the billing and CPQ audits we run at PinkSamurais, the pattern is consistent: the more systems a quote-to-cash process spans, the more of finance's month disappears into making them agree. The work is invisible on any org chart, but it is the first thing a unified setup removes.
3) The knock-on cost: a slow close and trapped cash
The reconciliation tax is not just lost hours. A close that drags has three further costs.
Decisions wait. Leadership cannot act on numbers it does not have. Every extra day of close is a day the business runs on last month's picture.
Cash stays trapped. The same disconnects that slow the close also slow invoicing, stretching Days Sales Outstanding and tying up working capital. MGI points to three financial tells that contracted and billed revenue have drifted apart: a rising DSO trend, contract assets or unbilled receivables growing faster than revenue, and deferred revenue that no longer reconciles cleanly to remaining obligations.
Leakage hides in the noise. When every close is a manual scramble, the small gaps between what was contracted and what was billed are exactly the kind of thing that slips through. That gap typically costs 1 to 5% of revenue, and we cover it in detail in Where Revenue Leakage Hides.
4) What teams reclaim once the systems are joined
Joining the quote-to-cash chain into a single source of truth turns reconciliation from a multi-day manual effort into an exception-based check. The benchmarks on the upside are as clear as the ones on the cost:
- A faster close. Ventana Research finds that close automation reduces cycle time by 30 to 50%, turning a ten-day close into five to seven, or a seven-day close into four to five.
- Reclaimed capacity. The hours previously spent matching data shift to analysis, forecasting, and decision support, the work finance is actually there to do.
- Cleaner cash. Faster, more accurate invoicing reduces DSO and releases working capital that was trapped in the receivables backlog.
None of this requires ripping out your systems. Most of the recovery comes from tightening the seams between contract lifecycle management, CPQ, and billing so that what is signed, what is billed, and what is booked stay in step by default. The full picture is in our complete guide to quote-to-cash execution.
Not sure how much your close costs you? Our CPQ & Billing Health Check is a focused diagnostic that shows where your systems fall out of step and what the reconciliation and leakage are costing you.
5) How to size your own reconciliation cost
You do not need a project to estimate this. One close cycle gives you a defensible number:
- Take your most recent month-end close and list the activities, with the hours each person spent.
- Flag every hour that was spent reconciling or matching data across systems, rather than genuine analysis or judgement.
- Multiply the reconciliation hours by twelve to annualise, and apply a loaded cost rate to put it in pounds.
- Compare your close length against the APQC benchmark (median about six days, top performers under five). The gap is your opportunity.
Most teams are surprised by how much of a skilled finance function's year is spent on work a connected system would simply remove.
6) Frequently Asked Questions
What is the reconciliation tax?
It is the recurring time and cost finance spends making disconnected systems agree before the books can close. It adds no value to the business, and fragmentation makes it grow.
How long should a month-end close take?
APQC benchmarking puts the median at around six calendar days, with top performers closing in under five and the slowest taking ten or more. Manual reconciliation accounts for an estimated 30 to 40% of that time.
Why does fragmented billing cause so much reconciliation?
Because contract terms, billing logic, usage data, and financial records sit in separate systems with no single source of truth, so someone has to match them by hand every period before the numbers can be trusted.
Do we need to replace our systems to fix it?
Usually not. Most of the gain comes from closing the seams between contract management, CPQ, and billing so the systems stay in step automatically, rather than ripping anything out.
Sources
- APQC, monthly close cycle-time benchmarks (median ~6 calendar days; top quartile under 5; slowest 10+).
- BlackLine research, manual reconciliation as 30 to 40% of the close; 10 to 20 hours per person per month.
- Adyen, share of companies losing at least a full working day per week to financial reconciliation.
- Ventana Research, close-automation cycle-time reduction of 30 to 50%.
- MGI Research, Revenue Leakage Series (2025), definition of leakage and the DSO, contract-asset, and deferred-revenue tells.
- EY revenue assurance estimates, revenue leakage of approximately 1 to 5% of revenue.
Keep reading
The reconciliation tax is one cost of a fragmented quote-to-cash process. For the highest-value one, see Where Revenue Leakage Hides, and for the full operating picture, the Complete Guide to Quote-to-Cash Execution.